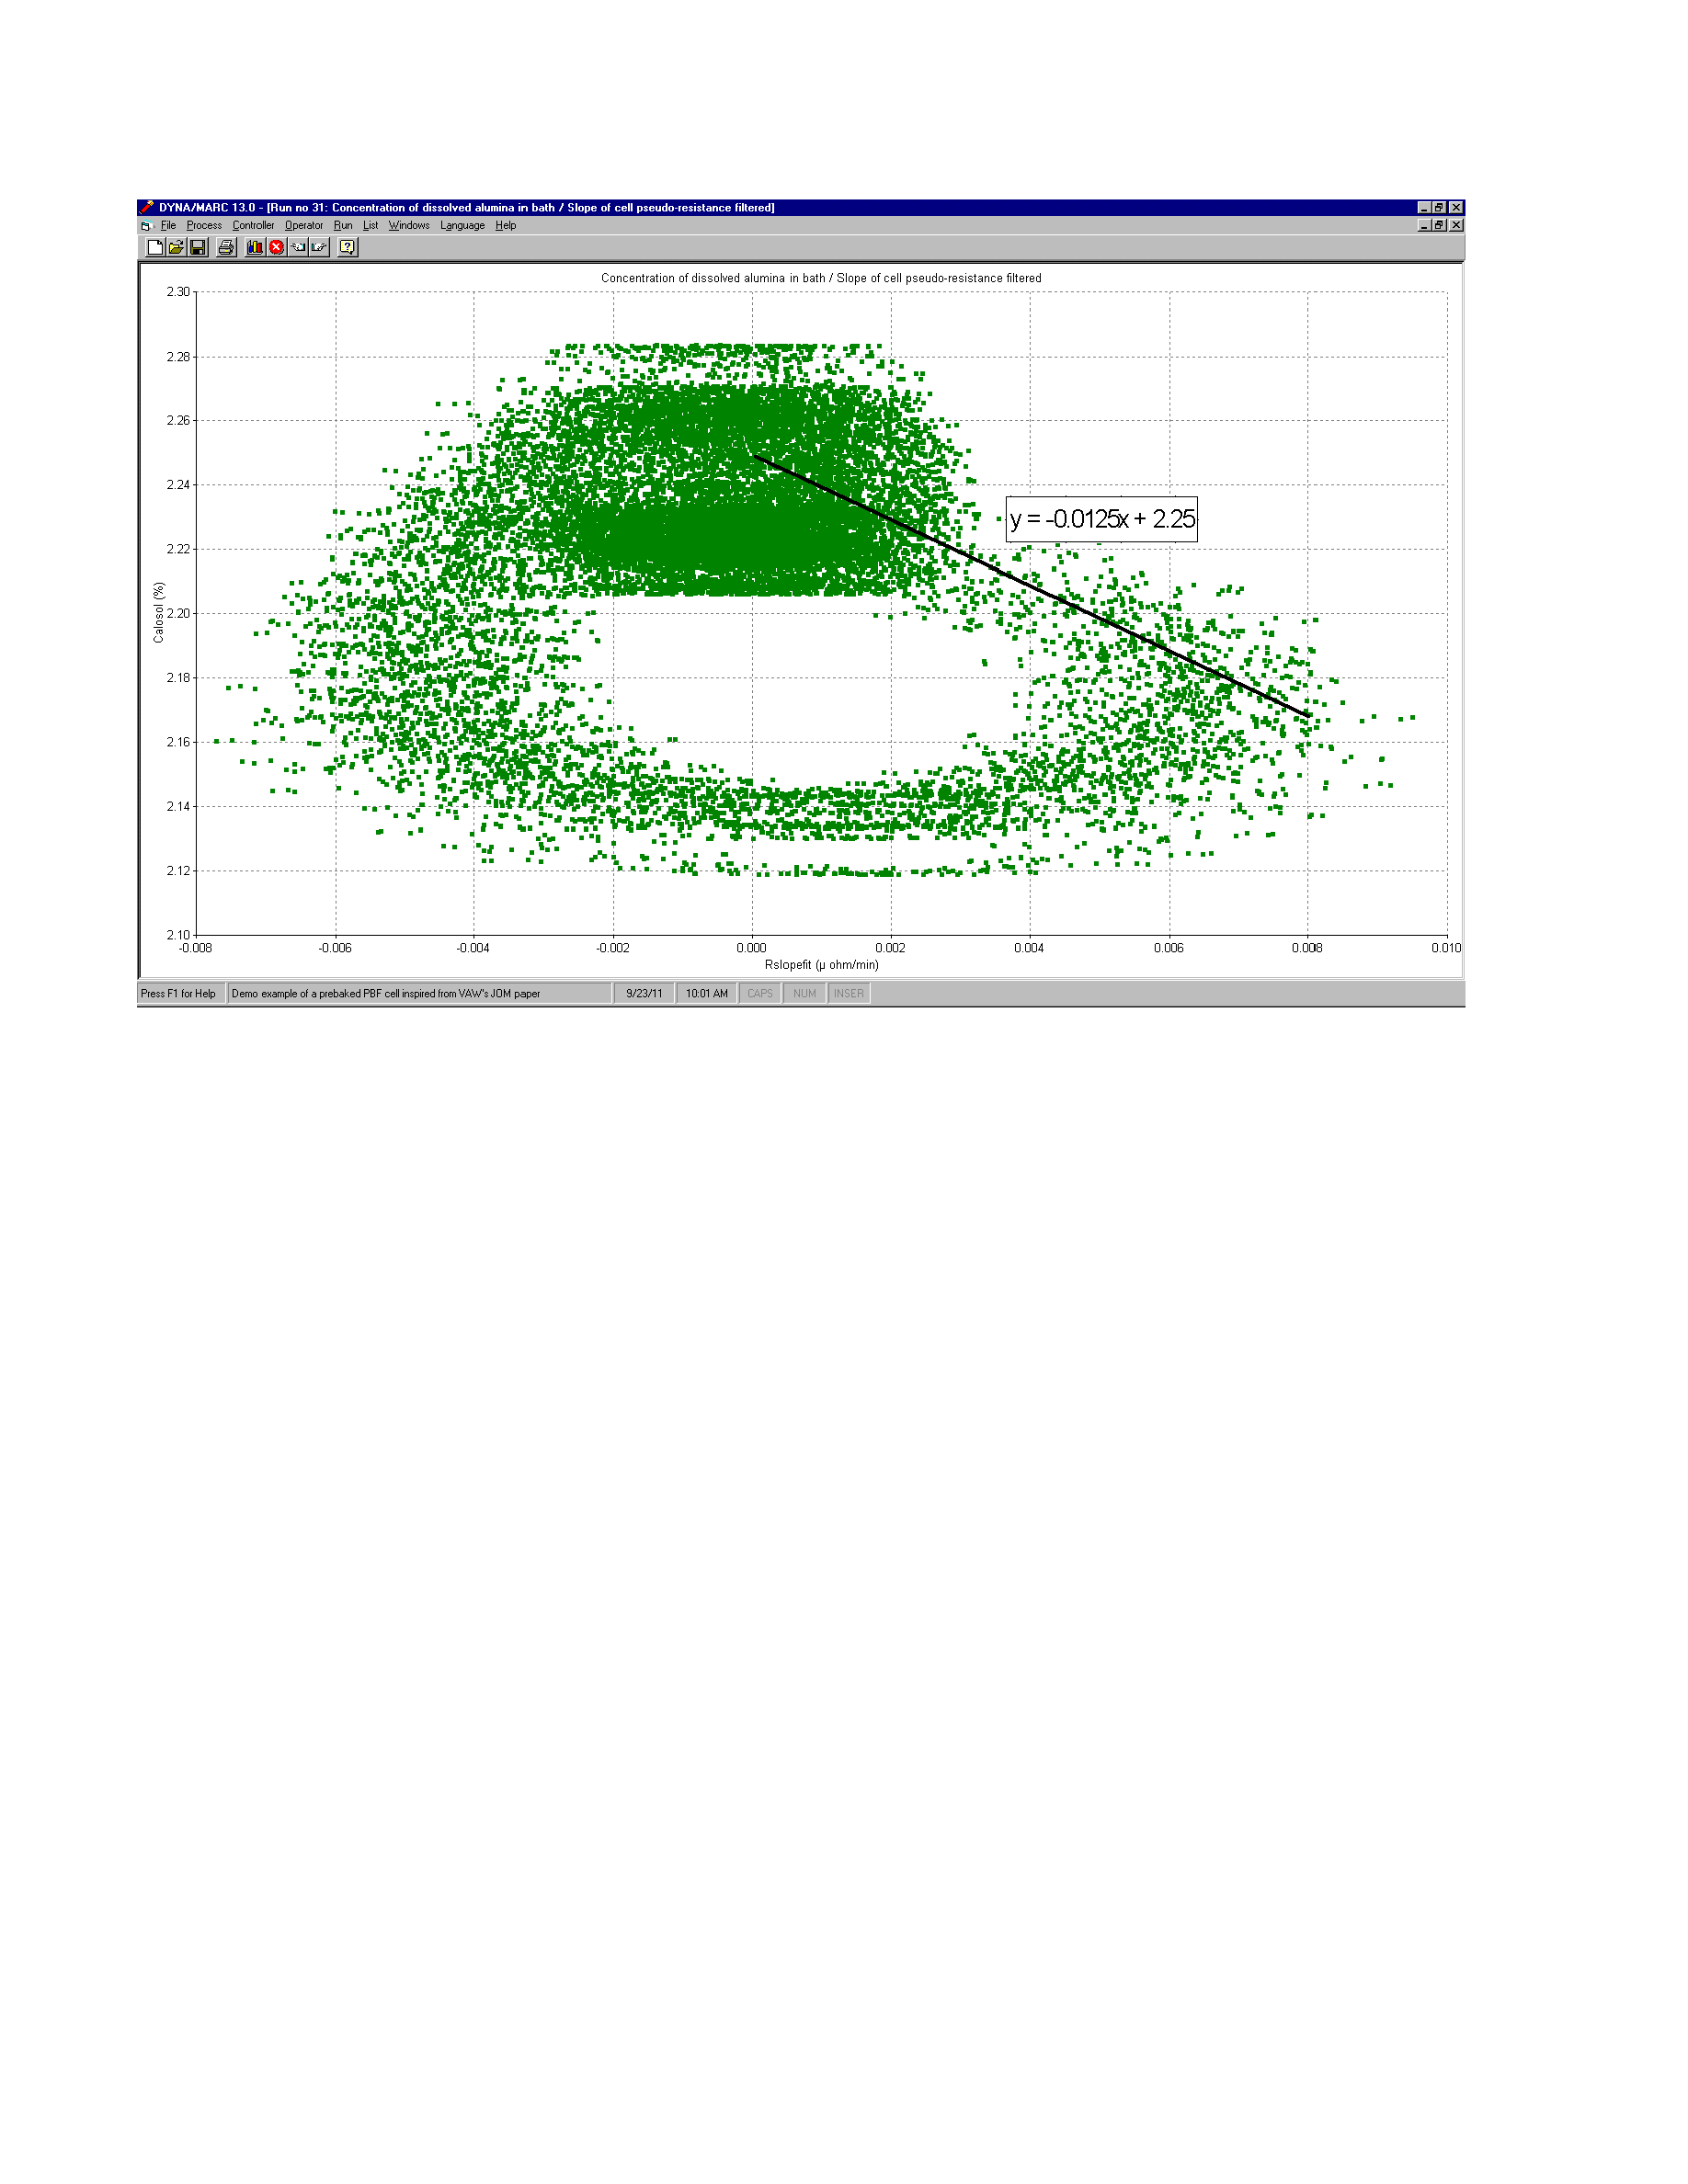
Figure 12: Correlation between the slope of the normalized cell voltage and the dissolved alumina
concentration for that 24 hours simulation